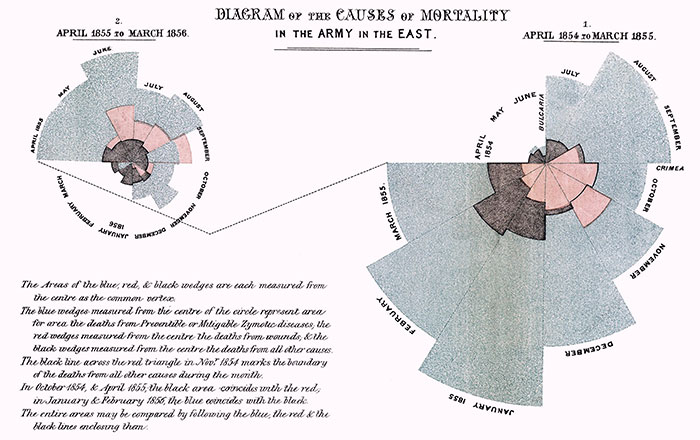
Example of polar area diagram by Florence Nightingale (1820–1910). This “Diagram of the causes of mortality in the army in the East” was published in Notes on Matters Affecting the Health, Efficiency, and Hospital Administration of the British Army and sent to Queen Victoria in 1858. This graphic indicates the number of deaths that occured from preventable diseases (in blue), those that were the results of wounds (in red), and those due to other causes (in black). This image is in the public domain in the United States as its copyright has expired. Courtesy of Wikimedia Commons: https://commons.wikimedia.org/wiki/File:Nightingale-mortality.jpg